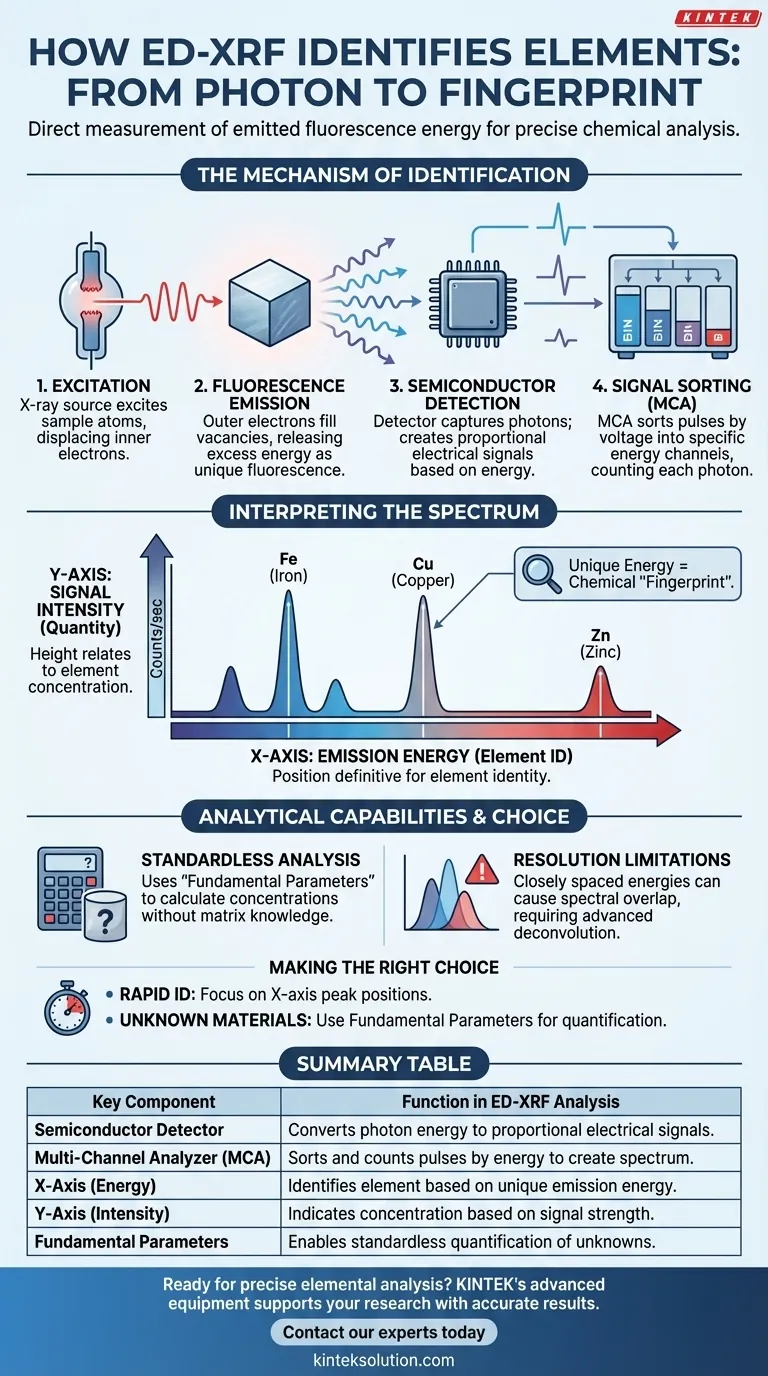
Energy-dispersive X-ray Fluorescence (ED-XRF) instruments identify elements by directly measuring the specific energy levels of photons emitted from a sample. A semiconductor detector captures this fluorescence and converts it into electrical signals, which are then processed to create a unique chemical "fingerprint" of the material.
The core principle is that every element releases fluorescence at a unique, known energy level. By measuring the energy of each incoming photon and plotting these counts on a graph, the instrument reveals exactly which elements are present.
The Mechanism of Identification
The process of identification involves a precise chain of events, moving from physical atomic reactions to digital signal processing.
Excitation and Fluorescence
The process begins when the instrument emits X-ray or gamma-ray beams into the sample. This radiation excites the atoms, displacing electrons from the inner orbital shells.
To restore stability, electrons from outer shells move in to replace the displaced inner electrons. This transition lowers the binding energy, releasing the excess energy as fluorescence.
The Semiconductor Detector
The spectrometer’s detector collects this emitted radiation in real-time. It is typically a semiconductor detector designed to discern fluorescent X-rays from the incident light.
Crucially, the detector creates electrical signals that are directly dependent on the energy of the incoming radiation. A high-energy photon creates a stronger signal than a low-energy photon.
Signal Sorting via the MCA
These raw electrical signals are passed to a multi-channel analyzer (MCA). The MCA acts as a digital sorter.
It categorizes every electrical pulse into a specific "channel" or "bin" based on its voltage (which corresponds to its energy). This allows the system to count how many photons struck the detector at every specific energy level.
Interpreting the Spectrum
The data collected by the MCA is converted into a visual spectrum, which is the primary tool for identification.
The X-Axis: Element Identity
The resulting graph plots Emission Energies on the x-axis. Because each element has a unique electron shell structure, it emits fluorescence at specific, predictable energies.
Therefore, the position of a peak along the x-axis definitively identifies the element (e.g., Iron will always appear at a specific energy point).
The Y-Axis: Signal Intensity
The y-axis represents Signal Intensity, measured in counts per second. This indicates how much radiation was detected at that specific energy.
While the position (X) tells you what is there, the height of the peak (Y) relates to how much is there.
Understanding the Analytical Capabilities
While ED-XRF is a powerful identification tool, understanding how it handles data quantification is essential for accurate results.
Standardless Analysis
A major advantage of ED-XRF is the ability to analyze samples without prior knowledge of the matrix.
Using a method called Fundamental Parameters, the instrument can calculate concentrations by combining data on fluorescence radiation and scattering processes. This allows for the analysis of unknown samples without needing specific matrix-matched calibration standards.
Resolution Limitations
Because the detector measures energy directly, the instrument relies heavily on the resolution of the semiconductor material.
If a sample contains elements with emission energies that are very close to one another, the detector may struggle to distinguish them as separate peaks. This can result in spectral overlap, requiring sophisticated software to deconstruct the signal.
Making the Right Choice for Your Goal
ED-XRF is a versatile tool, but how you utilize the data depends on your specific objectives.
- If your primary focus is rapid identification: rely on the peak positions along the x-axis to instantly correlate energy signatures with known elemental data.
- If your primary focus is analyzing unknown materials: utilize the Fundamental Parameters method to quantify concentrations without the need for pre-calibrated standards.
By treating the spectrum as an energy map, you can turn raw photon counts into a precise elemental breakdown of any sample.
Summary Table:
| Key Component | Function in ED-XRF Analysis |
|---|---|
| Semiconductor Detector | Converts the energy of incoming fluorescent X-rays into proportional electrical signals. |
| Multi-Channel Analyzer (MCA) | Sorts and counts electrical pulses by their energy level, creating the spectrum. |
| X-Axis (Energy) | Identifies the element present based on its unique, known emission energy. |
| Y-Axis (Intensity) | Indicates the concentration of the element based on the signal strength. |
| Fundamental Parameters | Enables standardless quantification of unknown sample concentrations. |
Ready to achieve rapid, precise elemental analysis in your lab?
KINTEK's advanced laboratory equipment, including precision components for analytical instruments, supports the accurate and reliable performance your research demands. Whether you are developing new materials or conducting quality control, our solutions help you get clear, definitive results.
Contact our experts today to discuss how we can support your laboratory's specific analytical needs.
Visual Guide
Related Products
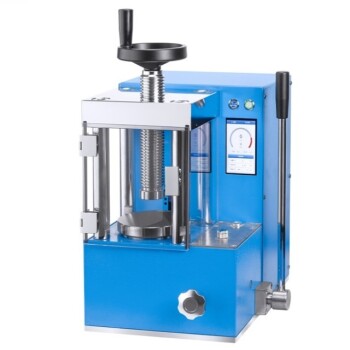
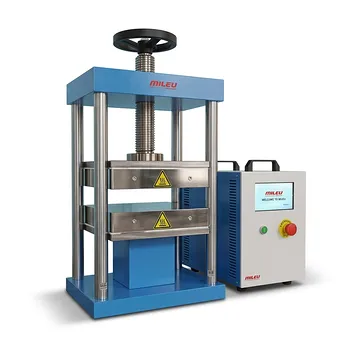
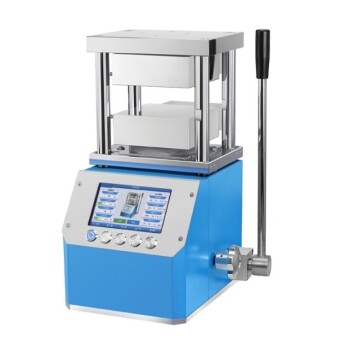
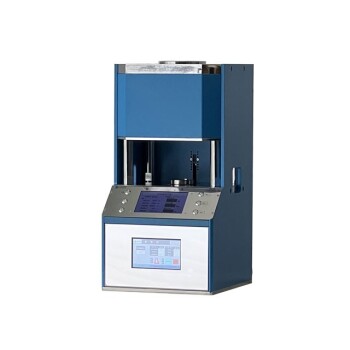
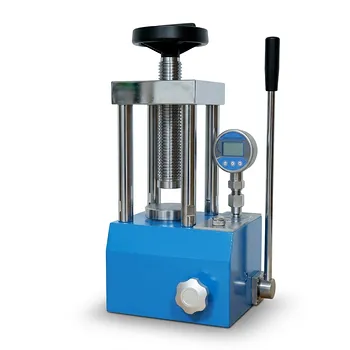
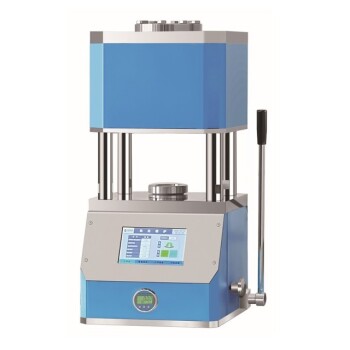
- Laboratory Hydraulic Pellet Press for XRF KBR FTIR Lab Press
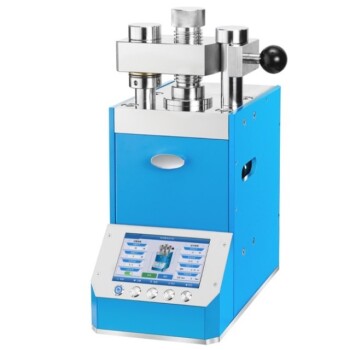
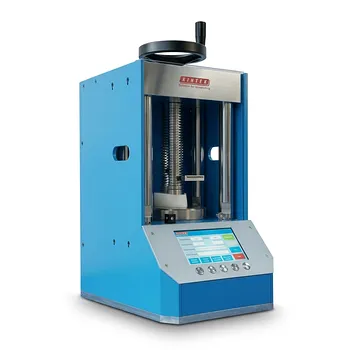
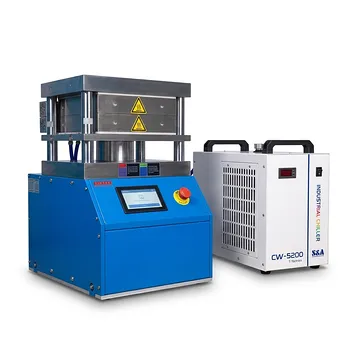
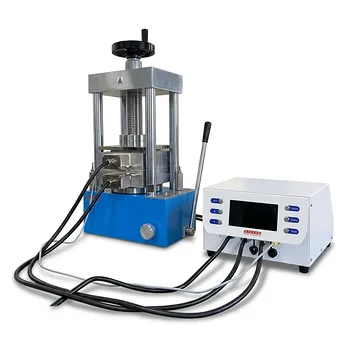
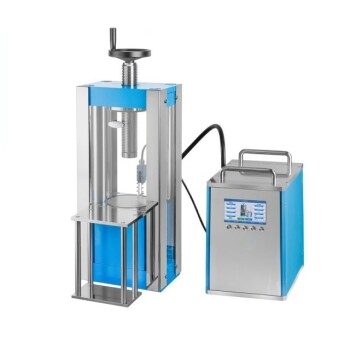
- Automatic Laboratory Hydraulic Press for XRF and KBR Pellet Pressing
- Lab XRF Boric Acid Powder Pellet Pressing Mold for Laboratory Use
- XRF KBR Plastic Ring Lab Powder Pellet Pressing Mold for FTIR
- XRF KBR Steel Ring Lab Powder Pellet Pressing Mold for FTIR
People Also Ask
- What are the different types of pellet-making tools available for labs? Choose the Right Press for Your Sample
- Why is precise pressure-holding control critical for biomass pellets? Master Your Densification Results
- Why is consistent holding pressure from a laboratory pellet press necessary? Ensure Data Integrity for Alloy Specimens
- Why is a professional laboratory pellet press required for XRF of silica sand? Achieve +/- 0.10% Precision
- Why is high consistency in holding pressure from a laboratory pellet press required when preparing multi-component alloy specimens?