In the analysis of recovered laboratory press samples, SEM and EDS function as an integrated diagnostic system. Scanning Electron Microscopy (SEM) is utilized to visualize the physical microstructure and quenching textures, while Energy Dispersive Spectroscopy (EDS) is applied to determine the precise chemical composition of the distinct phases observed.
The combination of these technologies converts physical samples into verifiable data points. By cross-referencing visual textures with chemical evidence, researchers can definitively confirm melting events and validate the accuracy of theoretical thermal models.
Visualizing Physical Structure with SEM
Observing Microstructure
SEM provides the high-resolution imaging necessary to examine the physical arrangement of the sample.
This allows researchers to characterize the grain structure and phase distribution that resulted from the high-pressure experiment.
Identifying Quenching Textures
A critical application of SEM in this context is the identification of quenching textures.
These textures capture the state of the sample at the moment of rapid cooling, providing a snapshot of the material's behavior at peak experimental conditions.
Analyzing Chemical Composition with EDS
Determining Phase Composition
While SEM provides the "visual," EDS provides the "chemical" context.
It analyzes the elemental makeup of the various phases identified by the SEM, ensuring that visual distinctions correspond to actual chemical differences.
Detecting Element Migration
EDS allows for the mapping of elements across the sample surface.
This is essential for detecting element migration, which indicates how materials diffused or segregated under high pressure and temperature.
Validating Experimental Models
Confirming Melt States
By combining microstructural imaging with chemical analysis, researchers can identify if the sample underwent melting.
Physical textures observed via SEM, corroborated by chemical segregation detected by EDS, provide definitive proof of a liquid state.
Evaluating Maximum Temperatures
The data extracted from these samples serves as a physical record of the thermal history.
Researchers use the observed textures and phase compositions to evaluate the actual maximum temperatures achieved during the experiment.
Providing Physical Evidence for Models
The ultimate goal of using these tools is to ground theoretical simulations in reality.
The micro-level information acts as physical evidence to validate thermal models, confirming whether the predicted conditions matched the experimental reality.
Understanding the Trade-offs
The Necessity of Dual Analysis
Relying on a single technique often leads to ambiguous results.
SEM alone can show a texture that looks like a melt, but without EDS, you cannot confirm the chemical fractionation required to prove it.
Contextual Interpretation
Conversely, EDS data lacks value without the spatial context provided by SEM.
Knowing the chemical composition is useless unless you can map it to specific microstructural features, such as grain boundaries or melt pockets.
Leveraging These Tools for Your Research
If your primary focus is Physical Characterization:
- Prioritize SEM to capture high-resolution images of grain boundaries, quenching textures, and structural defects.
If your primary focus is Chemical Evolution:
- Prioritize EDS to quantify phase compositions and track the migration of specific elements across the sample.
If your primary focus is Model Validation:
- You must integrate both datasets to correlate observed physical states with chemical changes, providing the robust evidence needed to confirm maximum temperatures and melt fractions.
These analytical techniques transform a recovered sample from a static object into a dynamic record of its thermal history.
Summary Table:
| Feature | SEM (Scanning Electron Microscopy) | EDS (Energy Dispersive Spectroscopy) |
|---|---|---|
| Primary Function | High-resolution microstructural imaging | Elemental chemical composition analysis |
| Key Insight | Grain structure & quenching textures | Phase composition & element migration |
| Data Output | Visual snapshot of physical state | Quantitative chemical mapping |
| Role in Validation | Identifies physical signs of melting | Confirms chemical fractionation/segregation |
Elevate Your Material Research with KINTEK
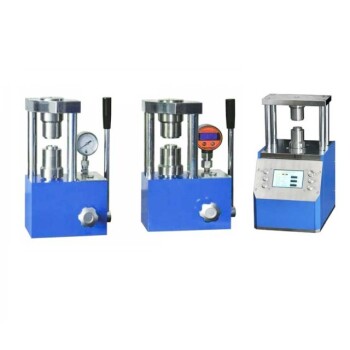
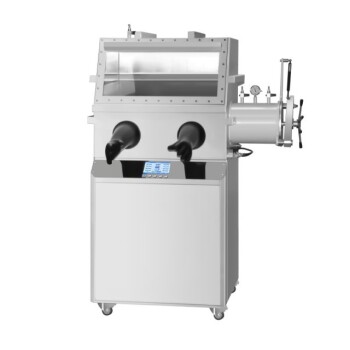
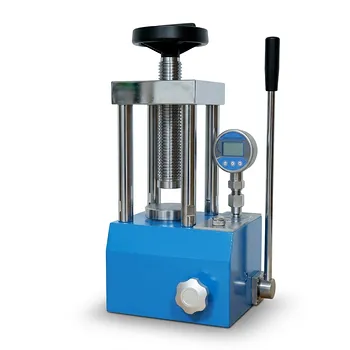
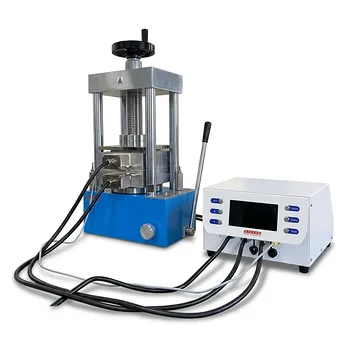
Precision analysis starts with a flawlessly prepared sample. KINTEK specializes in comprehensive laboratory pressing solutions designed for the most demanding research environments. Whether you need manual, automatic, heated, multifunctional, or glovebox-compatible models, or require advanced cold and warm isostatic presses, our equipment ensures the structural integrity and uniformity essential for accurate SEM and EDS characterization.
From battery research to high-pressure thermal modeling, KINTEK provides the tools to transform your samples into verifiable data. Contact us today to find the perfect press for your lab!
References
- Bingtao Feng, Bingbing Liu. A virtual thermometer for ultrahigh-temperature–pressure experiments in a large-volume press. DOI: 10.1063/5.0184031
This article is also based on technical information from Kintek Press Knowledge Base .
Related Products
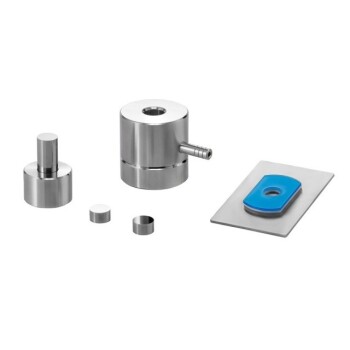
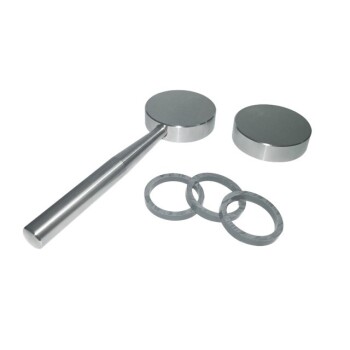
- Laboratory Hydraulic Pellet Press for XRF KBR FTIR Lab Press
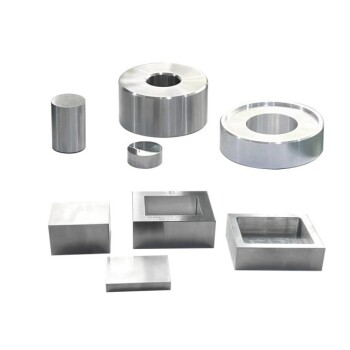
- Carbide Lab Press Mold for Laboratory Sample Preparation
- Laboratory Hydraulic Split Electric Lab Pellet Press
- Automatic Laboratory Hydraulic Press for XRF and KBR Pellet Pressing
- Square Lab Press Mold for Laboratory Use
People Also Ask
- What are the different types of pellet-making tools available for labs? Choose the Right Press for Your Sample
- Why is high consistency in holding pressure from a laboratory pellet press required when preparing multi-component alloy specimens?
- What is the necessity of a laboratory pellet press for alcohol by-product fuels? Maximize Energy Density & Consistency
- Why is precise pressure-holding control critical for biomass pellets? Master Your Densification Results
- Why is consistent holding pressure from a laboratory pellet press necessary? Ensure Data Integrity for Alloy Specimens